
Introduction
Time series forecasting and understanding time based patterns have many important applications. However, it is a territory often left unexplored, especially by ML practitioners, because of its relative complexity. To help people with domain knowledge, but without much expertise in creating statistical forecasting model, Facebook decided to come to rescue. And we will see the “whats, whys and hows” of that in this post.
Just to set the stage first, here are a few example forecasts:
- The demand for a grocery product at a supermarket each day
- The number of downloads of an app in a country for the next month
- Product sales in units sold each day in a retail store
- Yearly unemployment rate
- The closing price of a stock
- Expected yearly yield of a crop
- Population growth in a country
- Daily demand for a bus/airline/train
Now, let’s start by understanding what makes time series forecasting complex.
Not only the time component that makes these problems hard to solve, the following challenges add further to the existing complexity:
- Forecasting techniques are hard to tune because tuning them requires an in-depth understanding of the underlying models. And they are often too inflexible to incorporate any useful assumptions. For example, ARIMA is a popular and classic forecasting technique. The first input parameters to automated ARIMA are the maximum orders of the differencing, the auto-regressive components, and the moving average components. Sounds complicated, right?!
- People with deep domain expertise about specific products or services often lack statistical expertise to handle time series forecasting. On the other hand, people with technical expertise often lack domain expertise.
To address these challenges, Facebook released an open source forecasting library called Prophet. The great thing about Prophet is that it doesn’t require much prior experience with forecasting time series because it provides intuitive and easy to tune parameters. Hence, even someone who lacks expertise in time series modeling can use it to make meaningful predictions for their business scenario i.e. you can survive without being a statistician!
I will walk you through time series forecasting using Prophet in two main steps:
- Part1: Theoretical Background: In the first part of this post we are going to look at the main theoretical concepts of Prophet.
- Part2: Hands-on: In the second half, we will go through a practical example with financial time-series data using Python and Prophet.
Note: If you are only interested in the “demo part”/”what can be achieved” with Prophet, you can skip directly to Part 2.
Part 1: The Prophet Forecasting Model
The idea behind Prophet is quite simple. It represents a time-series as a combination of trend, seasonality and holidays. Patterns are represented at different scales — daily, weekly, seasonally, and yearly — along with an overall trend. For example, even though the usage of bikes is higher during summer, there exists an overall trend based on the population size of the city. This decomposable time series model can be represented by the following equation:
![]()
where:
- g(t) is the trend function which models non-periodic changes in the time series
- s(t) represents periodic changes (e.g., weekly and yearly seasonality)
- h(t) represents the effects of holidays
- εt: the error term represents information that was missed by the model
Trend
Prophet provides two variants for the trend function, g(t):
- Logistic Growth Curve – it uses a logistic function that allows modeling non-linear growth with saturation, i.e.:
- Growth is bound by a maximum carrying capacity — the trend hits a natural limit or saturates. For example, let’s say we are trying to forecast the number of people who will start using a new service in a given city for the next year. While the number of users will increase with time, the maximum number of users will have an upper limit imposed by the total number of residents i.e. maximum carrying capacity/saturation value.
- Time series can also encounter changes like a new product launch, unforeseen move by a competitor, acquisitions, elections etc. These are called trend changepoints, and the growth rate changes quite rapidly here — in real time series they tend to appear as abrupt changes in trajectories. (We will talk more about changepoints in part 2.)
- Prophet supports both automatic and manual tuning of both maximum carrying capacity and changepoints. The library can itself choose optimal values by fitting the supplied historical data but domain expertise can be used for fine tuning. A domain expert is likely to have a good estimate of the maximum carrying capacity or they would already know regarding important changepoints, so they can adjust these parameters manually.
- Piecewise Linear Model, when there is a constant rate of growth or no saturating growth.
Seasonality
The seasonal component, s(t) allows to flexibly model periodic changes due to weekly and yearly seasonality. For instance, a 5-day work week can produce effects on a time series that repeat each week, while vacation schedules and school breaks can produce effects that repeat each year. Prophet models these periodic effects using Fourier series.
Holidays and Events
Holidays and events provide large but predictable shocks to many business time series and often do not follow a periodic pattern, so their effects are not well modeled by a smooth cycle. For instance, many countries around the world have major holidays that follow the lunar calendar. The impact of a particular holiday is often similar year after year, and it is important to incorporate it into the forecast. Another example would be that of Black Fridays. So if you have holidays or other recurring events that you’d like to model, Prophet allows you to provide a custom list of past and future events.
For those interested in understanding the complete behind-the-scenes of Prophet, you can read to the original paper “Forecasting at scale”.
Part 2: Wearing our practical hat
Now that we have a good understanding of the nuts and bolts of Prophet, let’s dive into a real example and see its potential. We are going to analyze MSFT stocks. For retrieving financial data, I am going to use another awesome library, Quandl.
Quandl allows you to access a rich set of financial data with a single line of Python! For example, you can retrieve historical, end of day US stock prices, dividends, adjustments and splits for all publicly traded stocks. You can sign up for a free account and get an API key for sending requests to retrieve data from their API. If you have other sources of data, you are welcome to play with that data instead – I just found Quandl to be extremely handy.
Step 1: Retrieving Data
Let’s start by retrieving MSFT stocks data:

We can display the first and the last 5 rows of our dataset to see how the data looks like:

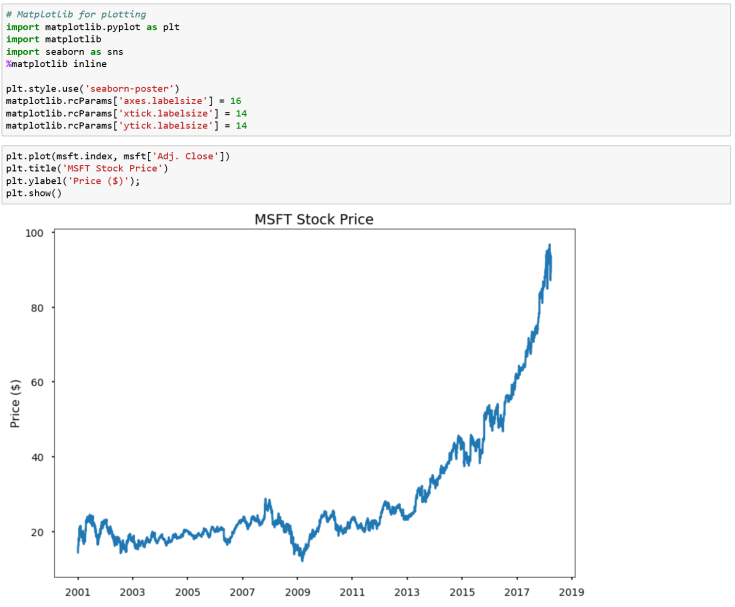
It can be helpful to start by looking at its graphical representation. In this tutorial, we are going to consider the Adjusted Closing Price as our variable of interest so let’s plot it:
Step 2: Creating the Forecasting Model
Now let’s bring Prophet into action.
Prophet requires the variable names to be specified as:
- y – Target Variable
- ds – Date
This means that we need to convert our dataframe according to the above specifications i.e. we need to move Date from index to a column labelled as ds and rename our target column, Adj.Close, to y. We can do this very easily as follows:

You can see that Date has now become a column and we have two columns called ds and y.
At this point, we are ready to fit our time series using Prophet and do some forecasting, and it’s as easy as pie! We can create our time series model and fit it to the data just like we do for “regular” Scikit-Learn models. Although we can pass some input parameters to the model via the constructor –fbProphet.Prophet(), we will start by seeing what we get by using default parameters:

Using the helper method Prophet.make_future_dataframe, we will create a dataframe which will contain all the dates of interest i.e. past and future dates. Then we can simply call the Prophet.predict method to retrieve our future forecasts for the chosen time period. Let’s say we are interested in the predictions for the next two years:

In the plot above, the black dots are the actual values (we only had data until the beginning of 2018), the blue line represents the predictions, and the light blue shaded region is the uncertainty of the forecast. The confidence interval grows wide further out in time because the estimate has more uncertainty as as we look further into the future — the initial uncertainty gets propagated and it keeps growing.
Step 3: Analyzing some trends and patterns
Now let’s look at the various components of our model i.e. overall trends and patterns:

We have a clear emerging trend: MSFT stocks are going up and up! We can see that there has been a marked rise after 2014. Can you guess why? Well, this man came to the rescue:

Microsoft shares have more than doubled since Satya Nadella became CEO; stocks have grown at an annualized rate of 23%.
The yearly pattern is particularly interesting because it seems like there is an increase in value at the end of the year, with a long slow decline into the summer. The lowest point seems to be July while something “magical” happens in October! I was curious about what happens in October to cause that trend, and interestingly, I found an online article talking about “why MSFT stocks jumped in October of 2017 by 12%.” Seems like this can be attributed to the company reporting strong fiscal first-quarter results near the end of the month.
To the readers having domain expertise, I would love to hear your take on the above trends i.e. whether they make sense or not and what are the main reasons that could be attributed to those ups and downs throughout the year.
Step 4: Tweaking parameters
When creating the model, I used the default value of 0.05 for the changepoint hyperparameter. What does this mean?
Changepoints are the points where a time series goes from increasing to decreasing or from increasing slowly to increasingly rapidly (or vice versa) — the greatest rate of change of the time series. The changepoint prior scale parameter is used to control how much emphasis we want to give to the changepoints in the model. If we use a high value, it means that we are being more sensitive or fitting too closely while a lower value means being less sensitive.
You might think that exact fitting is what we want to achieve. Here one needs to remember that fitting to the training data too well leads to the problem called overfitting i.e. the model does not generalize well to new data. On the other hand, a very loosely fit model is not what we are looking for either. So the goal is to to find the optimal balance of fitting the training data and being able to generalize to new data.
If we look at the dates that were considered as changepoints for the model we created above, we get the following:

Apparently, before 2014 there were some rapid ups and downs every year. While after October 2014, no changepoints were detected — a much smoother upward sailing curve!
Let’s explore the effect of the changepoint prior scale parameter by plotting predictions made with values ranging above and below its default value:

This graph clearly depicts the effect of underfitting vs overfitting. We can see that the blue line (lowest value for the changepoint_prior_scale parameter) does not closely follow the training data/the black line. On the other hand, the orange line (highest value of changepoint_prior_scale parameter) tries to follow the training observations very closely. The default value for the changepoint prior is 0.05 and it can be seen that the red line falls somewhere in between the two extremes.
So which value should you choose for your model? The best way to choose an optimal value would be to perform a numerical evaluation. You can split the data into training and validation set and then look at how the prediction error varies for different values of changepoint_prior_scale.
Conclusions about Prophet
This was one of the many ways of doing time series analysis, and we have just scratched the surface! There are many other methods ranging from more statistical approaches to deep learning. However, it needs to be said that Prophet is indeed an awesome tool for some quick forecasting. Its intuitive model can be tweaked by a person who has good domain knowledge but lacks technical expertise in creating forecasting models. As a first step in exploring time-series, Prophet is a great starting point. According to the creators of Prophet (of course, some bias here):
“We have found Prophet’s default settings to produce forecasts that are often accurate as those produced by skilled forecasters, with much less effort.”
End Notes
I hope that you enjoyed reading this post as much as I enjoyed writing it and that you have learnt something new.
BTW, if you are thinking that these forecasts can play out accurately in the actual market and you can get rich by doing so, I am sorry to disappoint you! Stock markets are a volatile business. That said, there are many other less tricky areas where this kind of analysis can be used for gaining some useful insights. Can you think of some other cool applications or do you have any specific business scenario in mind? Share your thoughts in the comment section below.
Thanks for reading and follow to receive the latest posts (once in a month or so) directly in your inbox! 🙂
References
- “Forecasting at scale” — the paper explaining the algorithm
- Prophet repository on GitHub
- Prophet documentation
- Blogpost on FBResearch

I’ve been working on time series prediction for a few months now. I’m predicting a lot of different sensors from industrial factories. So far this library seems to work pretty well on real data even out of the box especially on data which is seasonal through the year. It predicts nicely on a daily basis. Thank you Samia for the great post.
LikeLiked by 1 person
Thank you, Andrija! So glad to hear that it helped in solving a real problem. Keep rocking 🙂
LikeLike
Another wonderful read. Thank you Samia!
LikeLiked by 1 person
Thanks, Tariq! Glad you liked it 🙂
LikeLike